

Understanding The Math for Renewable Diesel: How Incentives Drive Profitability
Examining the credit stack of D4 RINs, LCFS, and 45Z CFPC

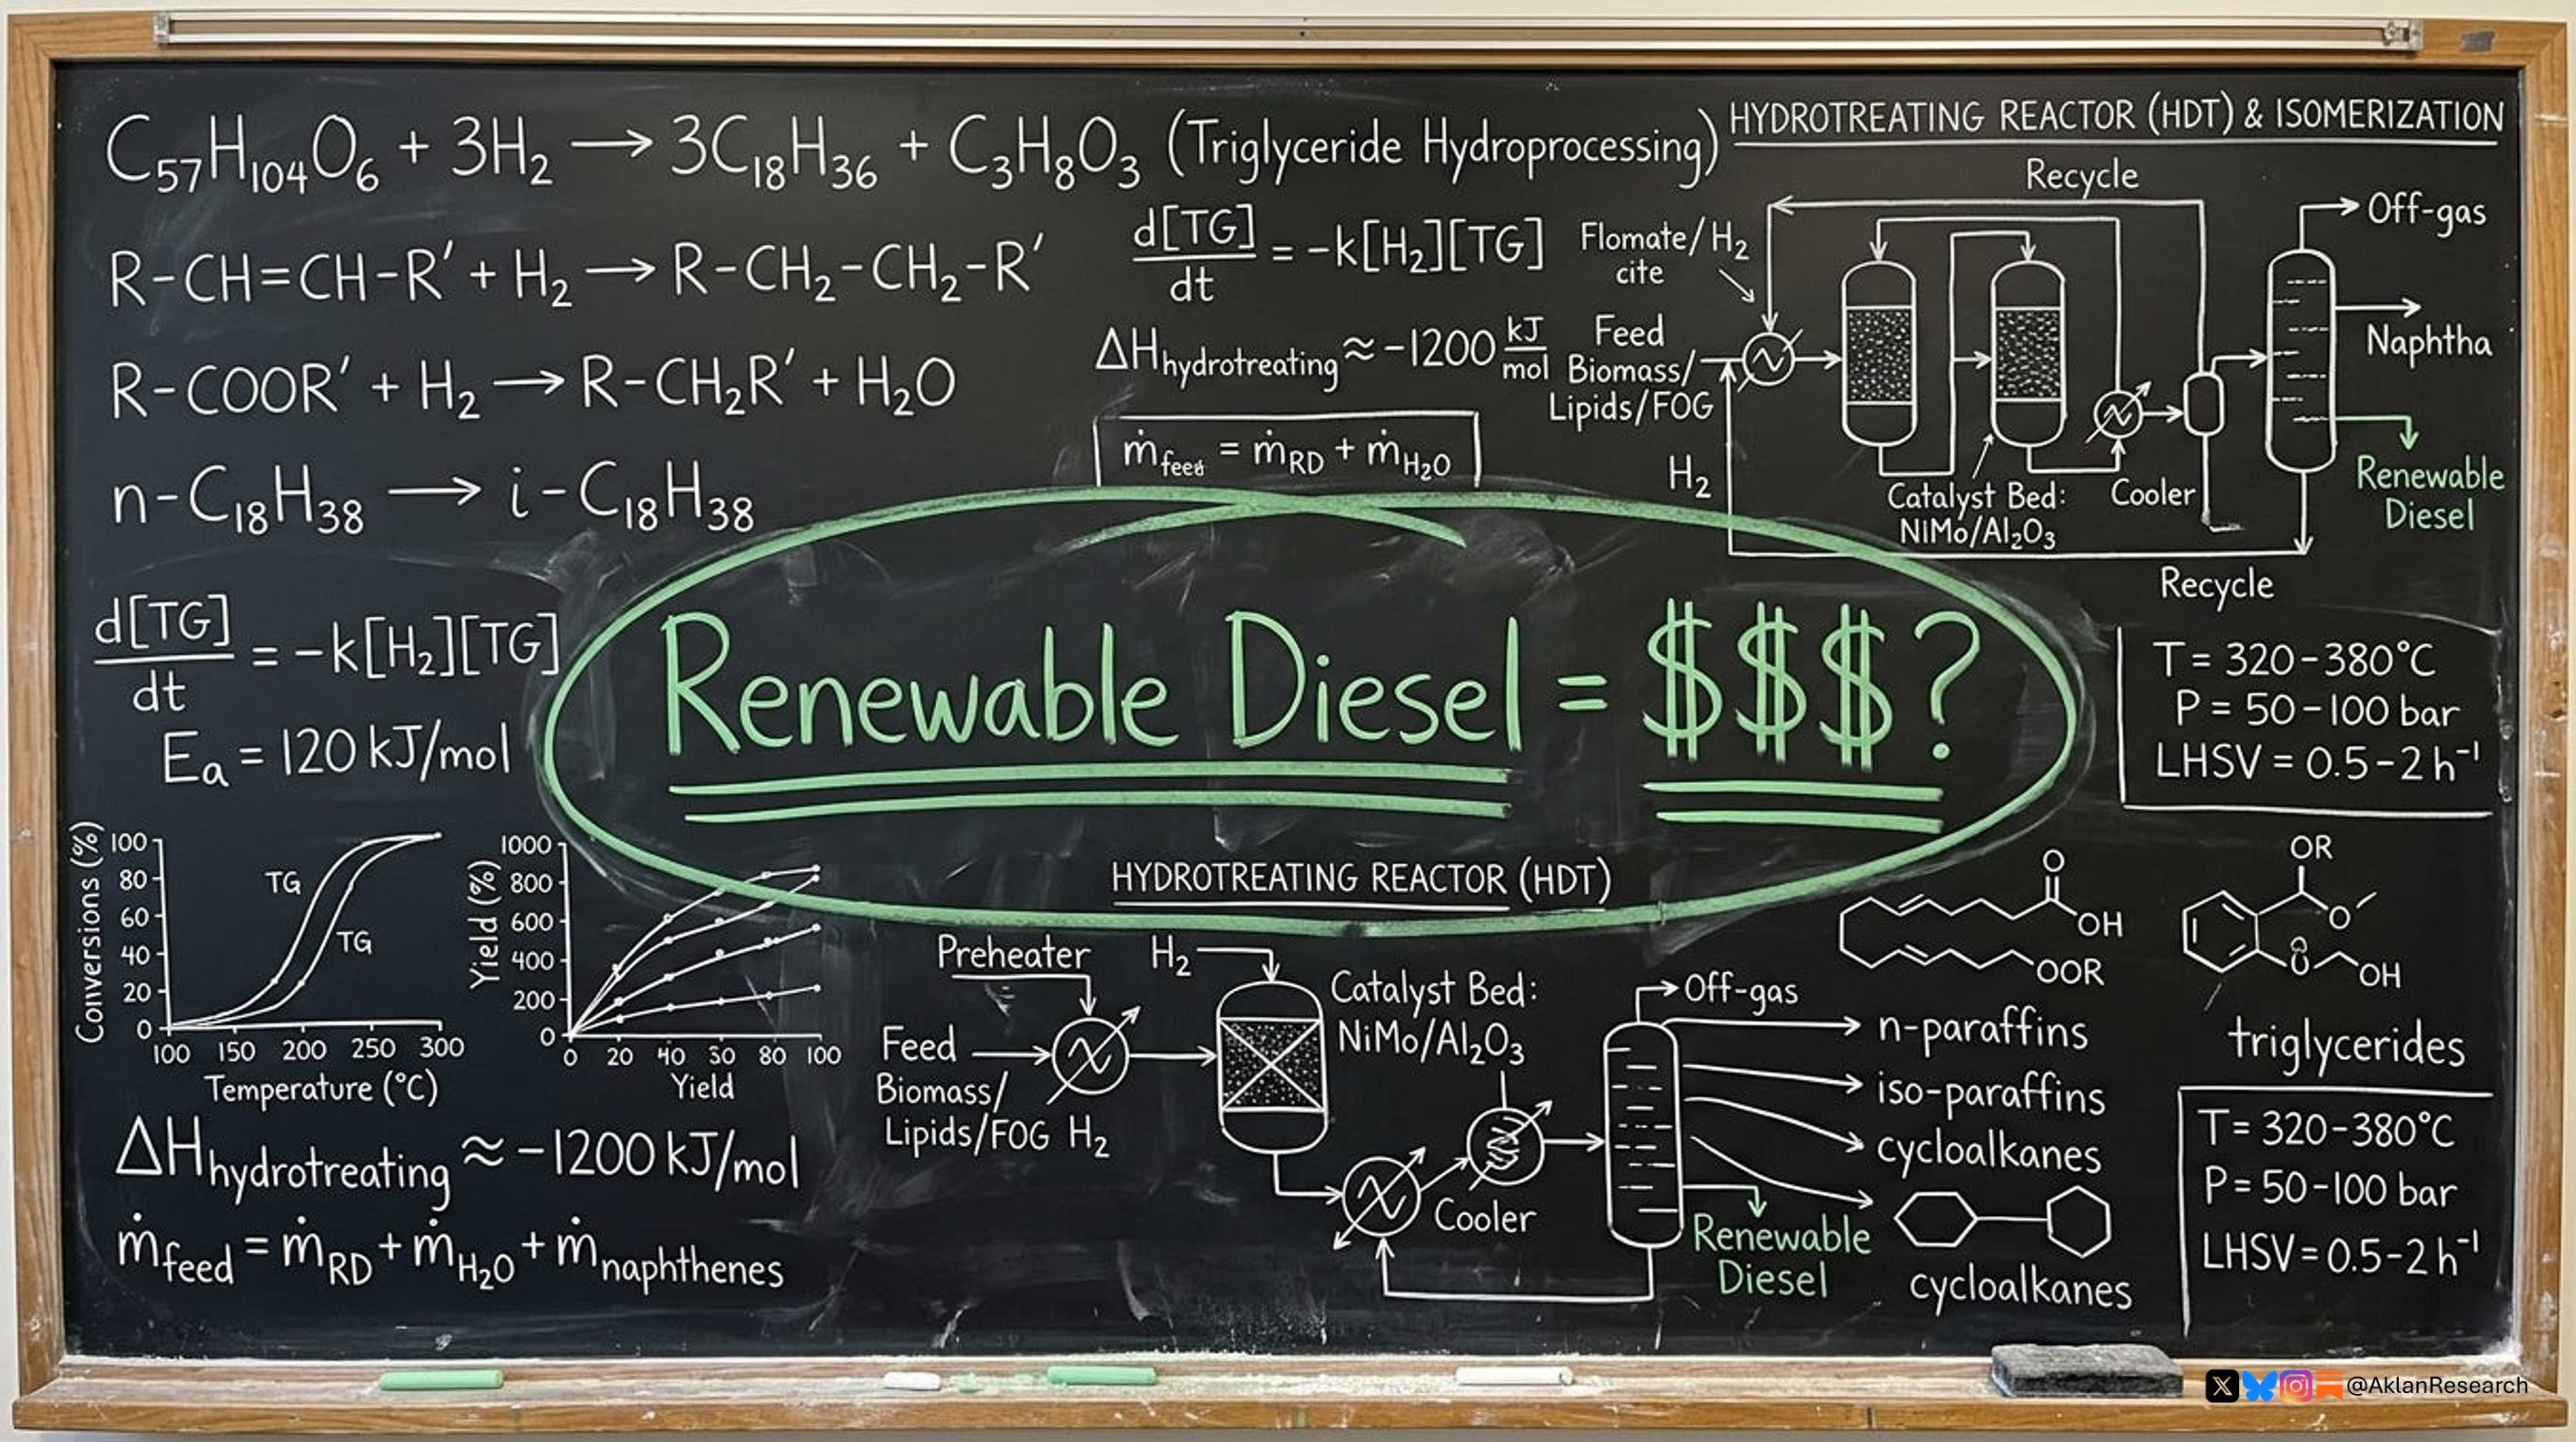
It’s a harsh truth that the energy transition away from fossil fuels will not happen overnight. It may take several decades, if not longer, to complete. The reality is that the world—especially developing nations—is still dependent on crude oil and refined products like gasoline and diesel.
So, by necessity, crude oil refiners will continue to play a critical role in society for the foreseeable future. Maybe even longer than some might like to admit.
Industries like shipping, agriculture, construction, and mining aren’t easy to decarbonize. Most heavy trucks, tractors, and construction/mining equipment are still powered by diesel—and it will likely continue to be that way until solid-state batteries or some other high energy density technology matures.
Until then, renewable diesel (RD) producers could play a vital role in mitigating carbon emissions in these industries.
Driven by a combination of federal mandates, state-level policy, and corporate decarbonization commitments, petroleum refiners have been steadily building out their renewable diesel capacity over the last several years.
However, given all the esoteric jargon and government incentives, it can be rather difficult to understand the space and the economics behind it.
What is renewable diesel anyway? Who makes it? And is the business of producing it even profitable?
I hope this primer helps to elucidate some of the opaqueness.
What is renewable diesel?
Renewable diesel is a fuel that can be derived from used cooking oil, animal fats (e.g., tallow), or vegetable oils (e.g., soybean oil).
That’s right. That used cooking oil at your local fast-food restaurant that’s going to be thrown out? It can be refined into renewable diesel!
When you account for the full lifecycle that includes growing/collecting feedstocks, processing, transport, and combustion, renewable diesel produces lower greenhouse gas emissions than conventional petroleum diesel.
Depending on the feedstock, RD can have 40-80% less carbon emissions than conventional diesel.1
RD is considered a “drop-in” fuel because it can be used directly in diesel engines and be transported through existing pipelines without modification.
This is an important distinction because renewable diesel is completely interchangeable with conventional diesel.
Other alternative fuels like biodiesel (BD) have blending limits or need specific infrastructure requirements.
Biodiesel has a different chemical composition than renewable diesel in that it has more oxygen which can be corrosive to pipelines. Biodiesel must also be blended with petroleum diesel because by itself it tends to “gel” in colder temperatures, absorbs moisture, and has the tendency to degrade engine gaskets.
It’s worth reiterating that renewable diesel and biodiesel are not the same thing.
Biodiesel is produced through a different chemical process (transesterification rather than hydrotreating) and has a different molecular structure than renewable diesel.
Renewable diesel is a drop-in replacement fuel. Biodiesel is not.
Who makes renewable diesel?
According to the EIA, there are 19 RD plants in the U.S. with a total nameplate capacity of ~308 Mbpd. Most of the capacity is located on the West and Gulf Coasts, notably California and Louisiana.
Diamond Green Diesel—a 50/50 joint venture between Valero (VLO 0.00%↑) and Darling Ingredients (DAR 0.00%↑)—is currently the largest renewable diesel producer in the U.S., with a capacity of ~78 Mbpd (or roughly a quarter of all domestic capacity).
Many of the independent refiners such as Phillips 66 (PSX 0.00%↑) and Marathon Petroleum (MPC 0.00%↑) have renewable diesel operations in addition to their primary business. Smaller names like DINO and PBF and integrated large-caps like Chevron (CVX 0.00%↑) are active in the space as well.
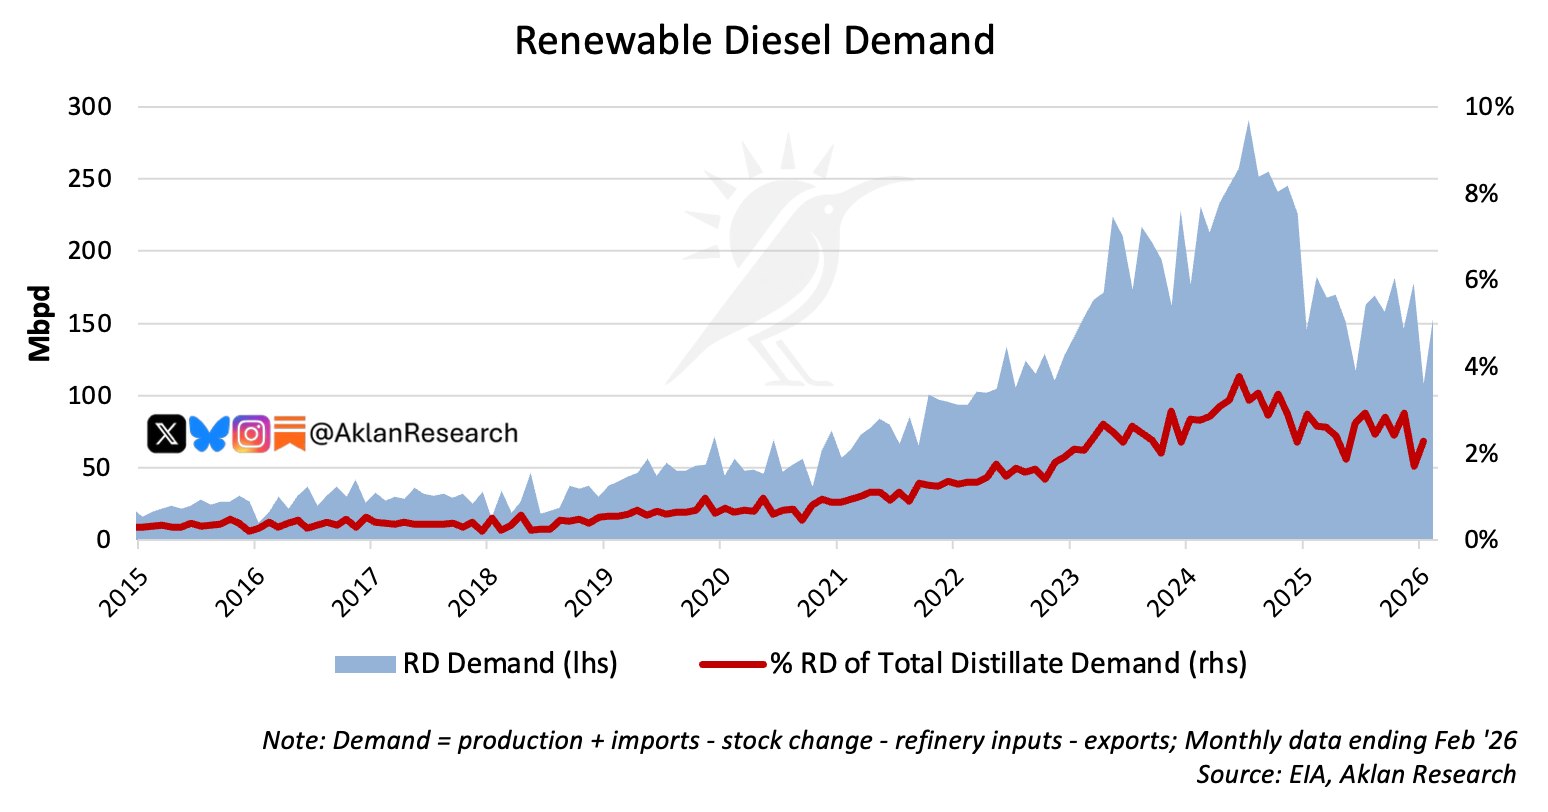
In terms of U.S. renewable diesel demand, consumption has averaged ~160 Mbpd (or ~3% of total distillate demand) over the last 12 months.
Demand has declined from its ‘24 peak due to the expiration of tax incentives for imported renewable fuels.
Prior to ‘25, a $1-per-gallon Blender's Tax Credit (BTC) applied to both domestic and imported renewable diesel . However, the Inflation Reduction Act was replaced with the Section 45Z Clean Fuel Production Credit, which took effect last year and covers only domestically produced RD (we’ll discuss the 45Z credit in detail later).
As a result, imported renewable fuels became comparatively less competitive and demand declined.
The issue was further impacted by over-construction of RD refineries in California which adversely impacted LCFS credit prices (more on that later too) to the point where it became less economical to produce the fuel.
Margin per barrel
The profitability of producing a barrel of renewable diesel is essentially:
fuel sale price - input cost + incentives
The industry commonly uses the BOHO spread—or the bean oil-heating oil spread to approximate how expensive it is to produce a barrel of RD without any incentives.
The spread is composed of the input cost (soybean oil) minus the diesel sale price (heating oil is often used as a proxy for diesel).
Therefore, a positive spread indicates that producing RD is unprofitable without subsidies, while a negative spread indicates inherent profitability.
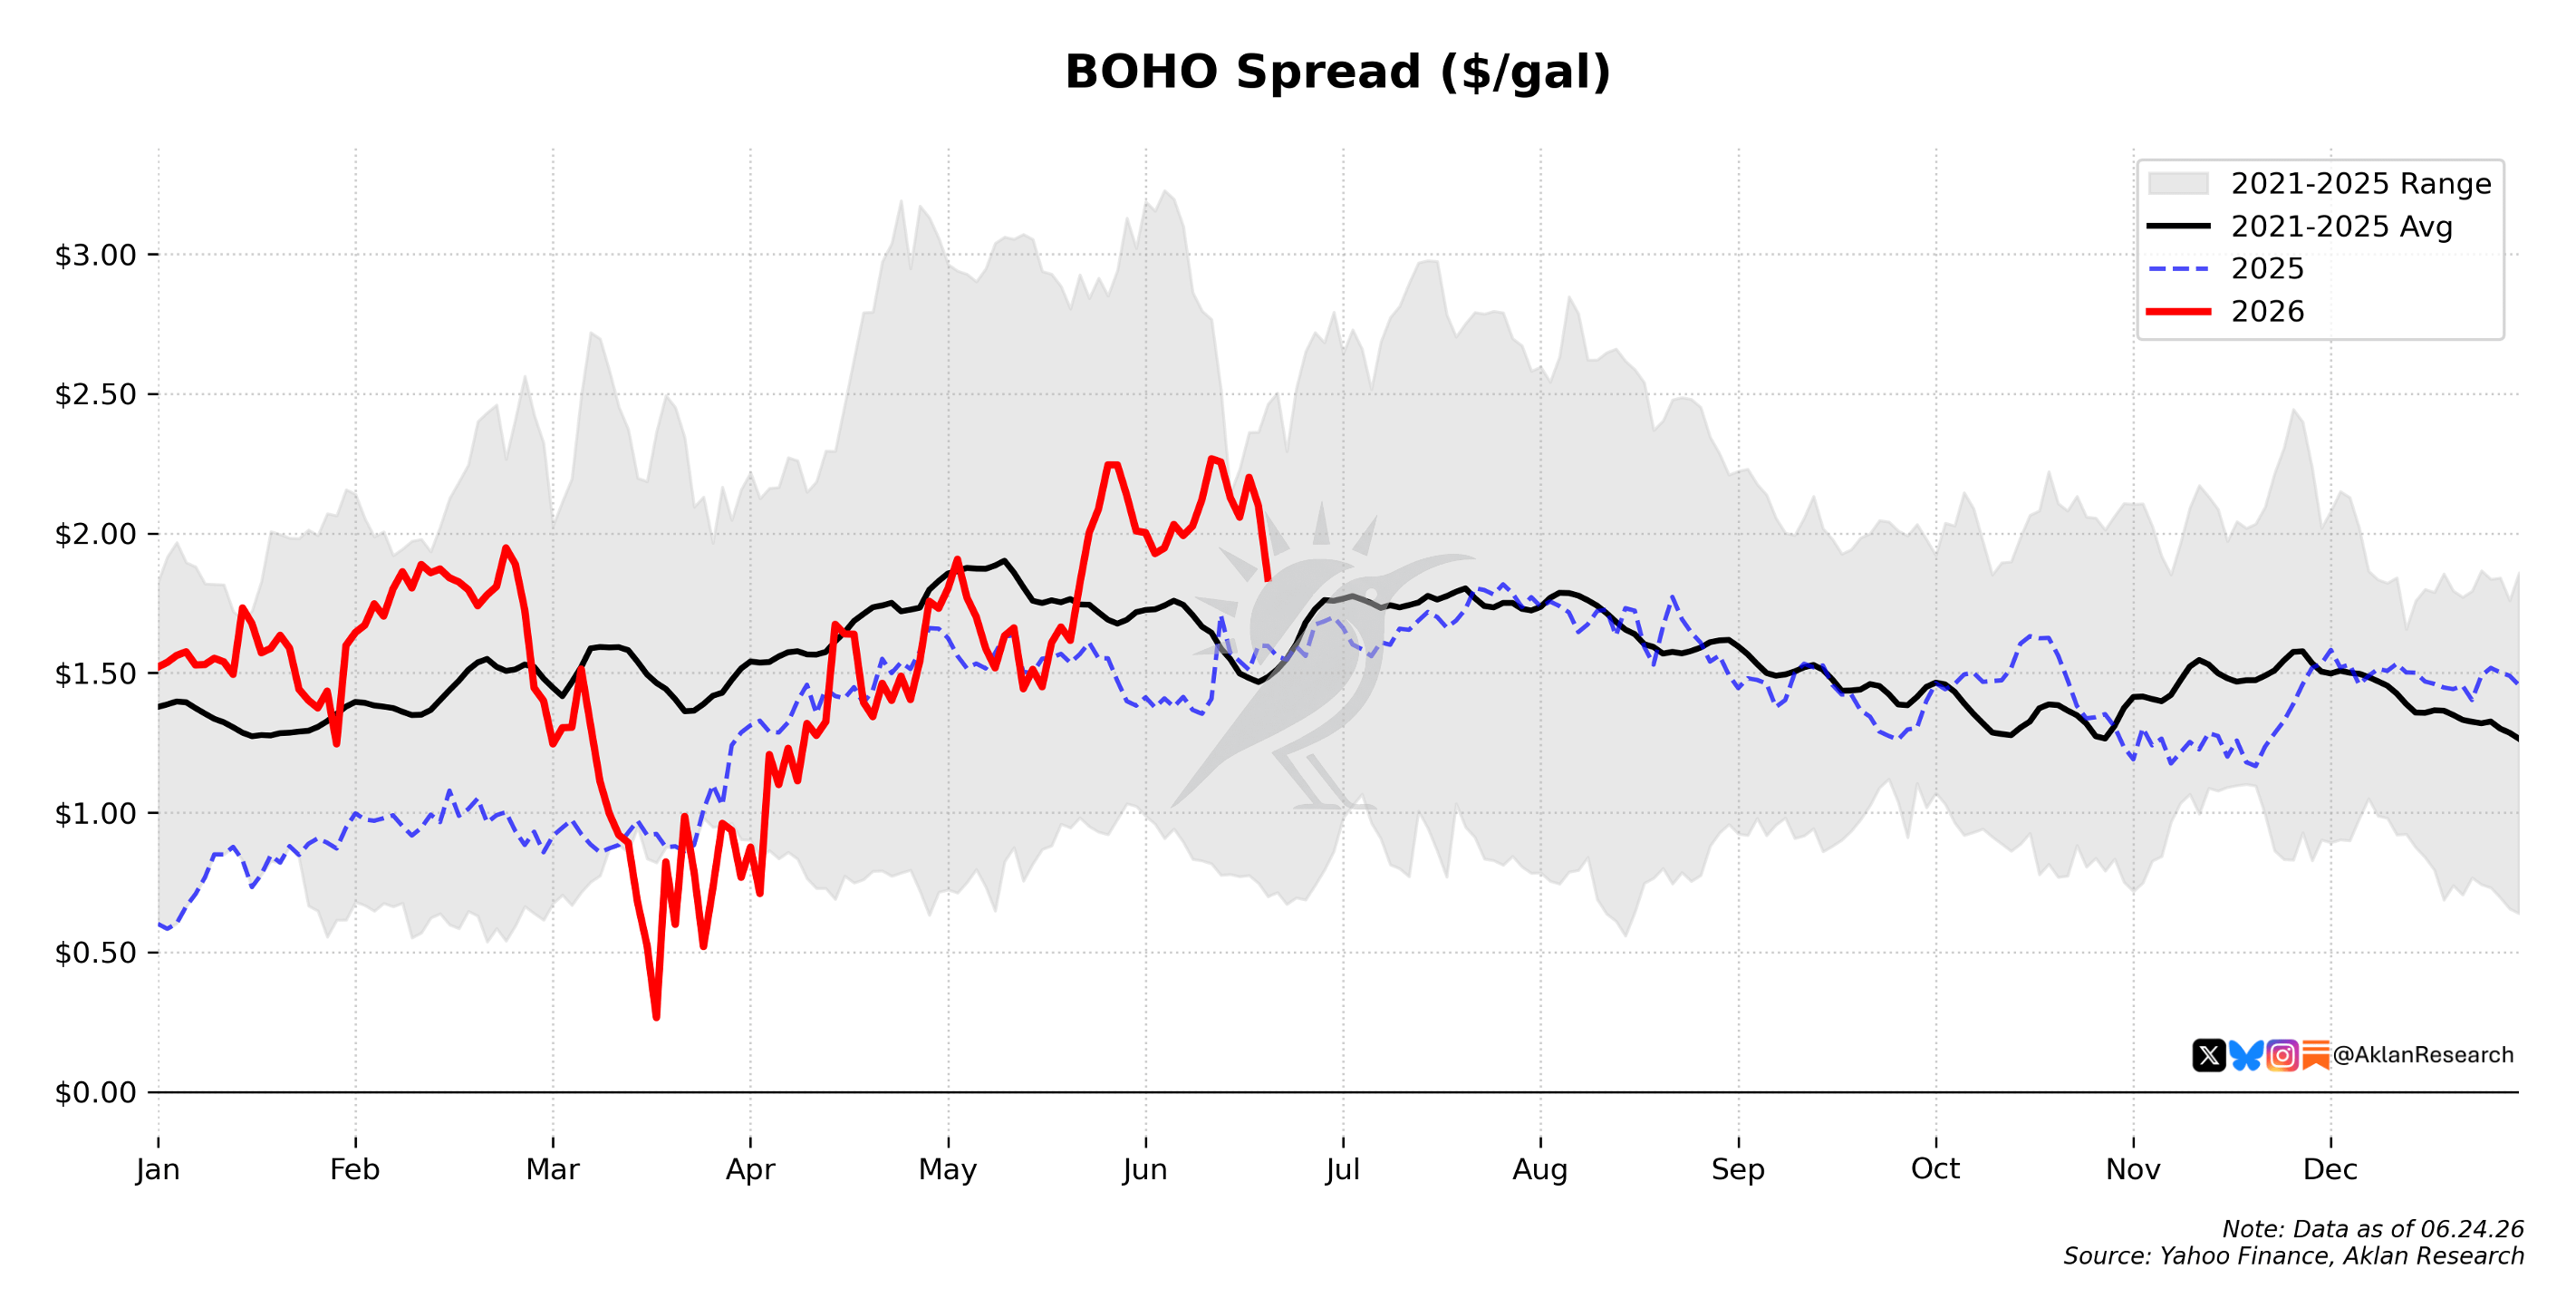
As shown in the BOHO spread above, producing renewable diesel is typically not profitable without any of the subsidies.
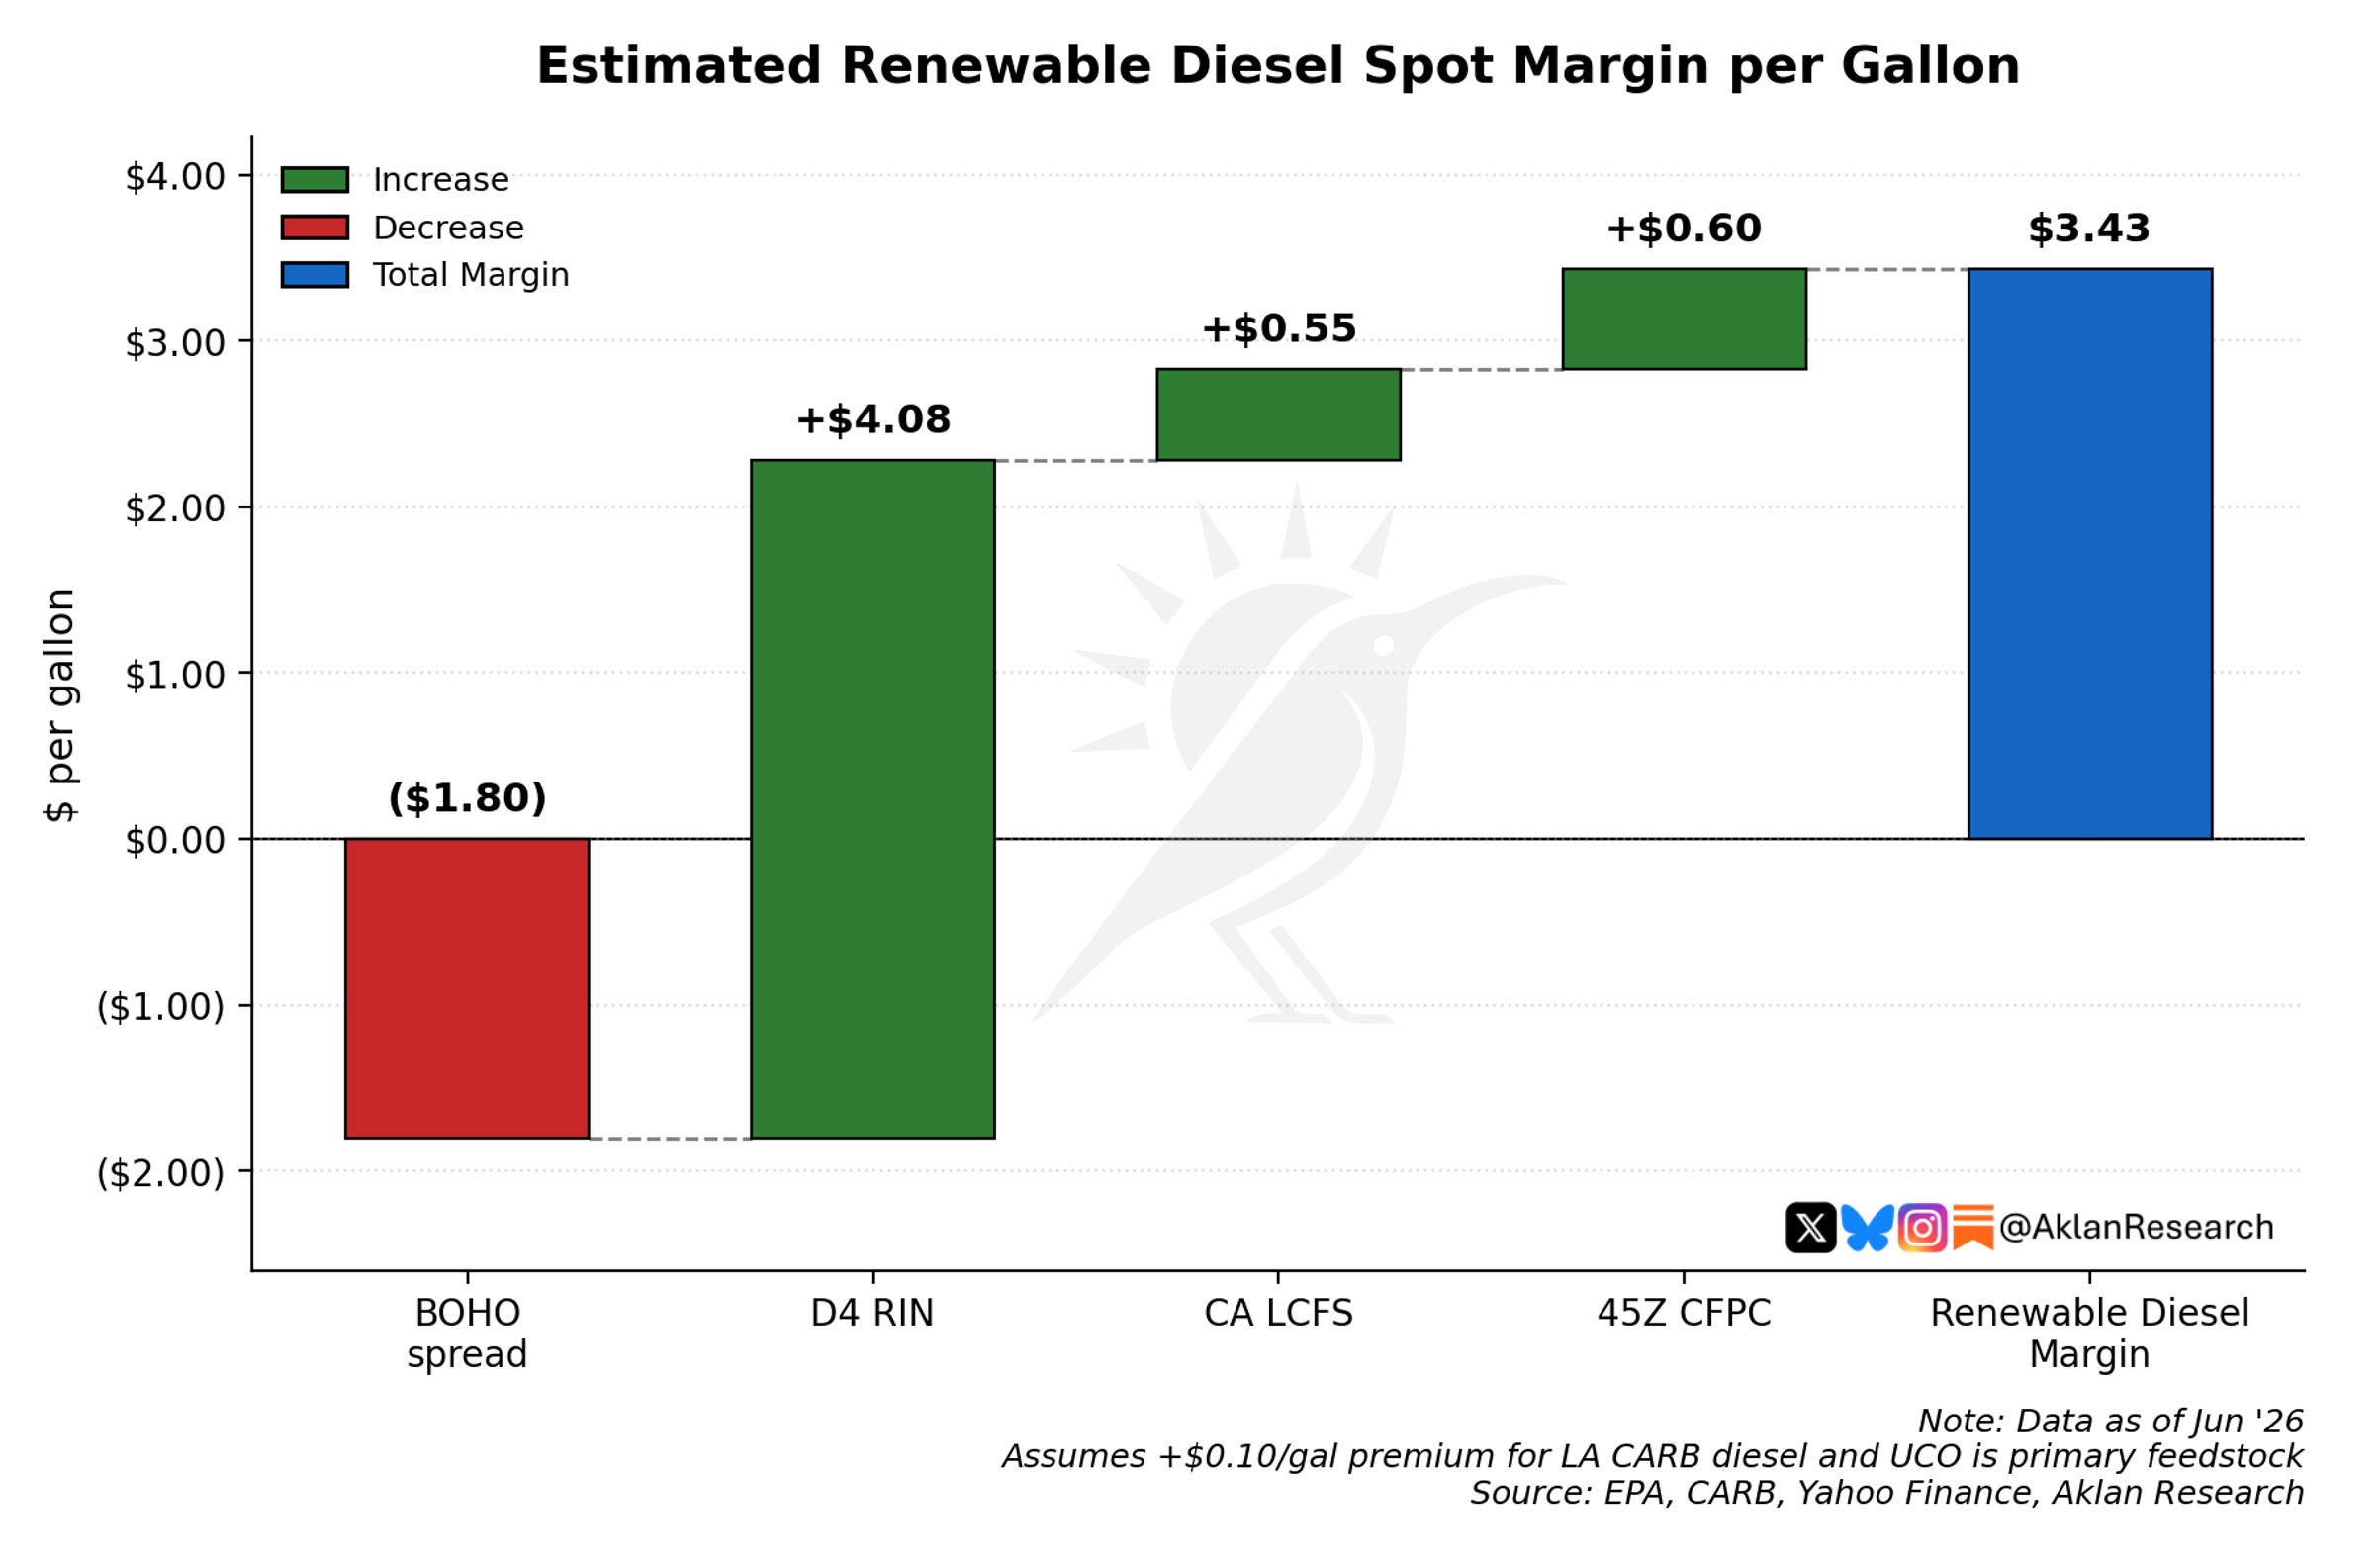
It is only after adding the D4 RIN, CA LCFS, and 45Z CFPC incentives that renewable diesel becomes profitable. All inclusive, I estimate the spot margin for RD to be roughly ~$3.40/gal.
In the end, the profit can be material. Take Diamond Green Diesel which produces 1.2 billion gallons of RD per year. At ~$3.40/gal, that would equate to ~$4.1 billion in incremental annual gross profit to be split between VLO and DAR.
All this said, the alphabet soup of incentives can be nuanced and challenging to understand for the uninitiated. So, let’s take a look at each of the subsidies.
D4 RINs
The Renewable Fuel Standard (RFS) is an EPA program that attempts to reduce greenhouse emissions by mandating that a specific volume of renewable fuel be blended into the nation’s transportation fuel supply each year.
Under this program, oil companies are obligated to blend a specific volume of renewable fuel every year, a target known as the Renewable Volume Obligation (RVO).
To track compliance, the EPA uses Renewable Identification Numbers (RINs). Every time a producer generates a gallon of renewable fuel, it receives a RIN—essentially a digital certificate proving that one gallon of renewable fuel entered the U.S. supply chain.
RINs are categorized by fuel type. Renewable diesel falls under the D4 RIN (Biomass-based diesel) category. There are also D3 RINs which cover cellulosic biofuels, D5 for advanced biofuels, and D6 for conventional biofuels like corn-derived ethanol.
Currently, one gallon of renewable diesel generates 1.7 D4 RINs. However, beginning January 1, 2027, the EPA’s finalized “Set 2” RFS rule lowers the default equivalence value to 1.5 D4 RINs though producers can petition the EPA for an alternative value up to 1.6 if they can document higher renewable content in their fuel.
D4 RINs have recently traded around $2.40/credit, near record highs, as the EPA’s sharply higher ‘26-‘27 volume mandates have pushed up compliance costs. At the current 1.7 RIN equivalence value, that puts the RIN value of a gallon of renewable diesel at roughly $4.10 today.
Following the EPA’s announcement that raises volume requirements for ‘26 and ‘27, the agency itself estimates that biodiesel and renewable diesel production will need to increase by over 60% compared to ‘25 levels to meet the new mandates—a major reason D4 RIN prices have already climbed toward record levels this year.
As D4 RIN prices rise, so does the profitability of renewable diesel.
LCFS Credits
The Low Carbon Fuel Standard (LCFS) is a market-based regulatory program that mandates a gradual reduction in the average carbon intensity of transportation fuels.
LCFS currently operates in several jurisdictions: California, Oregon, Washington, New Mexico, plus British Columbia alongside Canada’s federal Clean Fuel Regulations.
In the U.S., each program is run on the state level. For example, California’s LCFS is administered by the California Air Resources Board (CARB). It was the first of its kind when it launched in ‘11 and remains the largest and most liquid.
LCFS operates on a credit/deficit system and utilizes a CI benchmark. Each fuel sold is assigned a CI score based on its lifecycle emissions. Fuels that fall below the annual CI benchmark generate credits while fuels that fall above the benchmark generate deficits.
The program requires that petroleum refiners must balance deficits with credits, either by generating their own through cleaner fuel sales or by purchasing credits from producers with a surplus on the open market.
The annual CI benchmark itself declines over time, becoming more stringent each year. This means fuels that generate credits today may generate fewer credits in the future as the standard tightens—creating a built-in incentive for ongoing emissions reduction rather than a static compliance target.
Because renewable diesel typically carries a significantly lower CI score than conventional petroleum diesel, RD producers selling into LCFS-covered markets generally generate credits.
The value of those credits is set by the market. For CA LCFS credits, prices can fluctuate due to credit supply levels, compliance activity, the pace of clean fuel adoption, and periodic regulatory updates from CARB.
Furthermore, the value generated depends heavily on the feedstock: RD made from waste fats like used cooking oil or tallow commands a significantly lower CI score—and thus generates more credits—than RD produced from virgin vegetable oils like soybean oil.
Right now, California LCFS credits go for ~$66/MT, which converts to ~$0.55 per gallon of renewable diesel.
And the credit price varies by LCFS program too. Oregon LCFS credits (~$150/MT) currently trade at a premium to California’s. Consequently, we’ve seen more renewable diesel siphoned away from California and into the Pacific Northwest as producers try to capture the higher revenue.
While there is ongoing discussion in several other states about adopting LCFS-style programs, the geographic concentration of these incentives continues to funnel the vast majority of domestic RD supply into West Coast and Southwest markets.
Clean Fuel Production Credit
The Section 45Z Clean Fuel Production Credit (CFPC) is a federal tax incentive that replaced the long-standing Biodiesel Blender's Tax Credit (BTC). The program aims to subsidize fuels with less carbon emissions.
Created under the 2022 Inflation Reduction Act, 45Z originally applied to qualifying fuel produced domestically after ‘24 and sold through ‘27.
The One Big Beautiful Bill Act (OBBBA) then extended the credit by two more years, through ‘29—giving RD producers a longer runway to plan around the incentive.
CFPC is structured as a pay-per-gallon incentive and its value is tied directly to the environmental profile of the fuel, known as its Carbon Intensity (CI).
CI measures greenhouse gas emissions spanning the entire lifecycle of a fuel—from feedstock sourcing and processing all the way through distribution and combustion.
It is expressed in grams of CO₂-equivalent per megajoule of energy (gCO2e/MJ) and is calculated using the federal GREET model.
Ultimately, the CI score depends on the feedstock used. The lower the carbon emissions, the lower the CI score. And the lower a fuel’s CI score, the greater the credit per gallon.
As in our previous example, VLO/DAR’s Diamond Green Diesel uses mostly low-CI used cooking oil (UCO) which I estimate generates ~$0.60 per gallon of RD from 45Z.
Final Thoughts
Some investors might view the crude oil refining sector as passé, offering limited upside given the rise of electric vehicles and renewable energy. However, renewable diesel (as well as sustainable aviation fuel or SAF) could emerge as a powerful growth engine.
The profitability of Diamond Green Diesel demonstrates that the financial rewards can be material—although deeply tethered to the “alphabet soup” of subsidies.
For now, these incentives appear to be locked in for at least the next few years. As such, the investment thesis for RD will hinge on two factors: 1) feedstock sourcing and 2) regulatory agility.
As the EPA lowers default RIN equivalence values and local LCFS markets face supply gluts, margins will inevitably tighten. The true winners in this space will not just be the companies with the largest nameplate capacity, but those with the integrated supply chains to secure cheap, quality feedstocks and the geographic flexibility to transport RD to the highest-premium markets.
Disclosure: I do not own shares in any of the companies listed above as of the publication date.
The information provided here is solely for informational purposes and should not be construed as investment advice. Please seek guidance from a licensed professional before making any investment decisions. Although the information and statistical data presented herein have been sourced from reputable entities, the accuracy and completeness is not guaranteed. This report includes statements and observations on investment strategies, individual securities, and market conditions. However, there is no assurance that these statements, opinions, or forecasts will be accurate. Past performance is not a guarantee of future results. These comments may also include speculative opinions that should not be regarded as factual statements. My views and opinions may include forward-looking statements which may or may not be accurate over the long term. This information is a snapshot in time and is subject to change at any moment. I reserve the right to buy or sell any security at any time without prior notification. No part of this material may be shared or reproduced without prior written permission from Aklan Investment Research.
Xu et al. “Life cycle greenhouse gas emissions of biodiesel and renewable diesel production in the United States” Environmental Science & Technology, 56(12), 7512–7521